


Market Watch Q3
Buyer’s Market Conditions Emerge but Prices Hold Steady
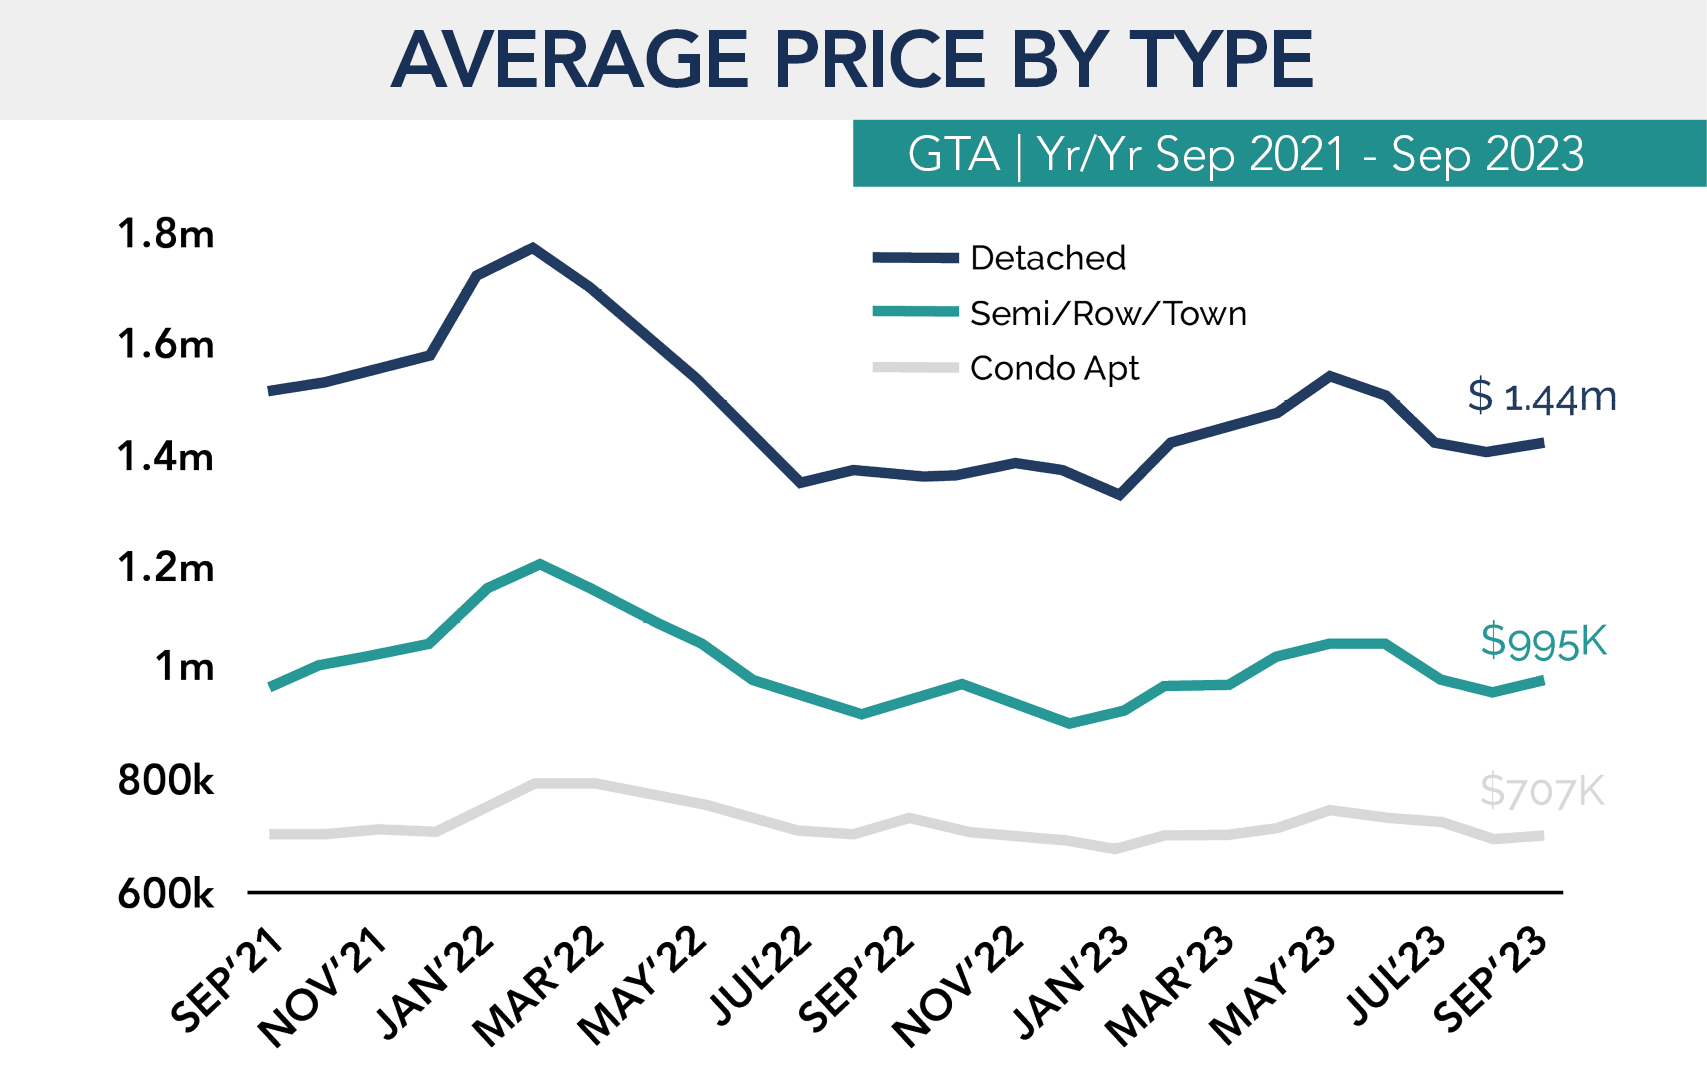
Prices Grew Annually for All Housing Types Except Condo
The GTA showed signs of a buyer’s market emerging during September as the economic data and latest communications from the Bank of Canada suggested that interest rates will need to remain elevated for longer than expected.
This put upward pressure on bond yields and fixed-term mortgage rates, reducing ownership affordability and causing more homeowners to list their properties for sale.
Average selling prices held up well during September even as supply pressures began to mount. Prices increased 3.4% month-over-month. On an annual basis, average prices increased 3.0% to reach $1.119 million. Compared to two years ago, prices were down slightly by 1.4%.
Despite the softer market conditions, the average time on market of 20 days on market was in line with the 10-year average.
Average prices edged up on a month-over-month basis for all housing types in September. Detached average prices rose 5.2% from a year ago to $1.44M while average prices for semis/rows/towns grew 4.3% annually to $995K.
When compared to the market peak in February 2022, condo prices have held up best among all housing types with an 11.6% decline, which can be attributed to a relatively smaller run-up in prices as interest rates dropped during COVID-19.
Inventory Updates

With new listings rising equally fast across housing types, inventory levels saw significant increases last month for all market segments.
Condo apartment inventory jumped mainly due to a rise in investor-owned listings, rising from 3.4 months in August to 5.0 months of supply in September, while detached homes saw inventory rise from 3.1 to 3.9 months and semis/rows/towns moved from 2.2 to 3.4 months of supply during the month.
Sales of detached homes and semis/rows/towns recorded annual declines of 7% and 14%, respectively, while condo apartment sales were unchanged from a year ago in September.
When compared to 10-year average sales levels, activity dropped substantially across all housing types, led by a 42% decrease in sales for semis/rows/towns and followed by a 39% decline in detached sales and a 34% drop in condo sales.
Sales Increase for $2 Million-Plus Homes

Homes priced at $2 million-plus were the only market segment to experience month-overmonth growth in sales during September, with activity rising 11%. Sales of $2 million-plus homes also recorded the strongest year-over-year increase at 10%, closely followed by 9% annual growth for homes selling in the $1.75-1.99 price range. The higher end of the market generally isn’t as exposed to rising interest rates, which may be motivating buyers of expensive homes to take action as more homes arrive on the market for sale.
Sales and Prices Rise for Detached Houses in Toronto

Sales and prices for detached homes performed better in the City of Toronto than in the 905 Region during September. City of Toronto detached sales grew 10% annually, led by 20-21% increases in Toronto West and Toronto Central. This compares to a 12% year-over-year decline in detached sales in the 905.
Furthermore, the 6% annual increase in median detached prices was double the 3% increase in the 905, with City of Toronto detached inventory of 3.4 months falling below the 905 level of 4.0 months.
Conversely, the condo market was comparatively weaker in Toronto than in the 905, with sales down 3% in Toronto (up 3% in the 905) and prices down 2% (flat in the 905). Across the entire GTA market, the highest level of inventory was for condos in Toronto Central at 5.9 months.
Market Health based on Supply Levels
Seller’s Market = 4 months of inventory or less
Balanced Market = 4 - 6 months of inventory
Buyer’s Market = 6 months of inventory or more
Sales declined 7.1% annually in September to 4,642 transactions, which was 39% below the 10-year average and the slowest September for sales since 1999.
Meanwhile, new listings rose 44% year-over-year in September, pushing down the ratio of sales-to-new listings to 29% — the lowest level since the Financial Crisis in January 2009 and substantially below the 10-year average of 49%.
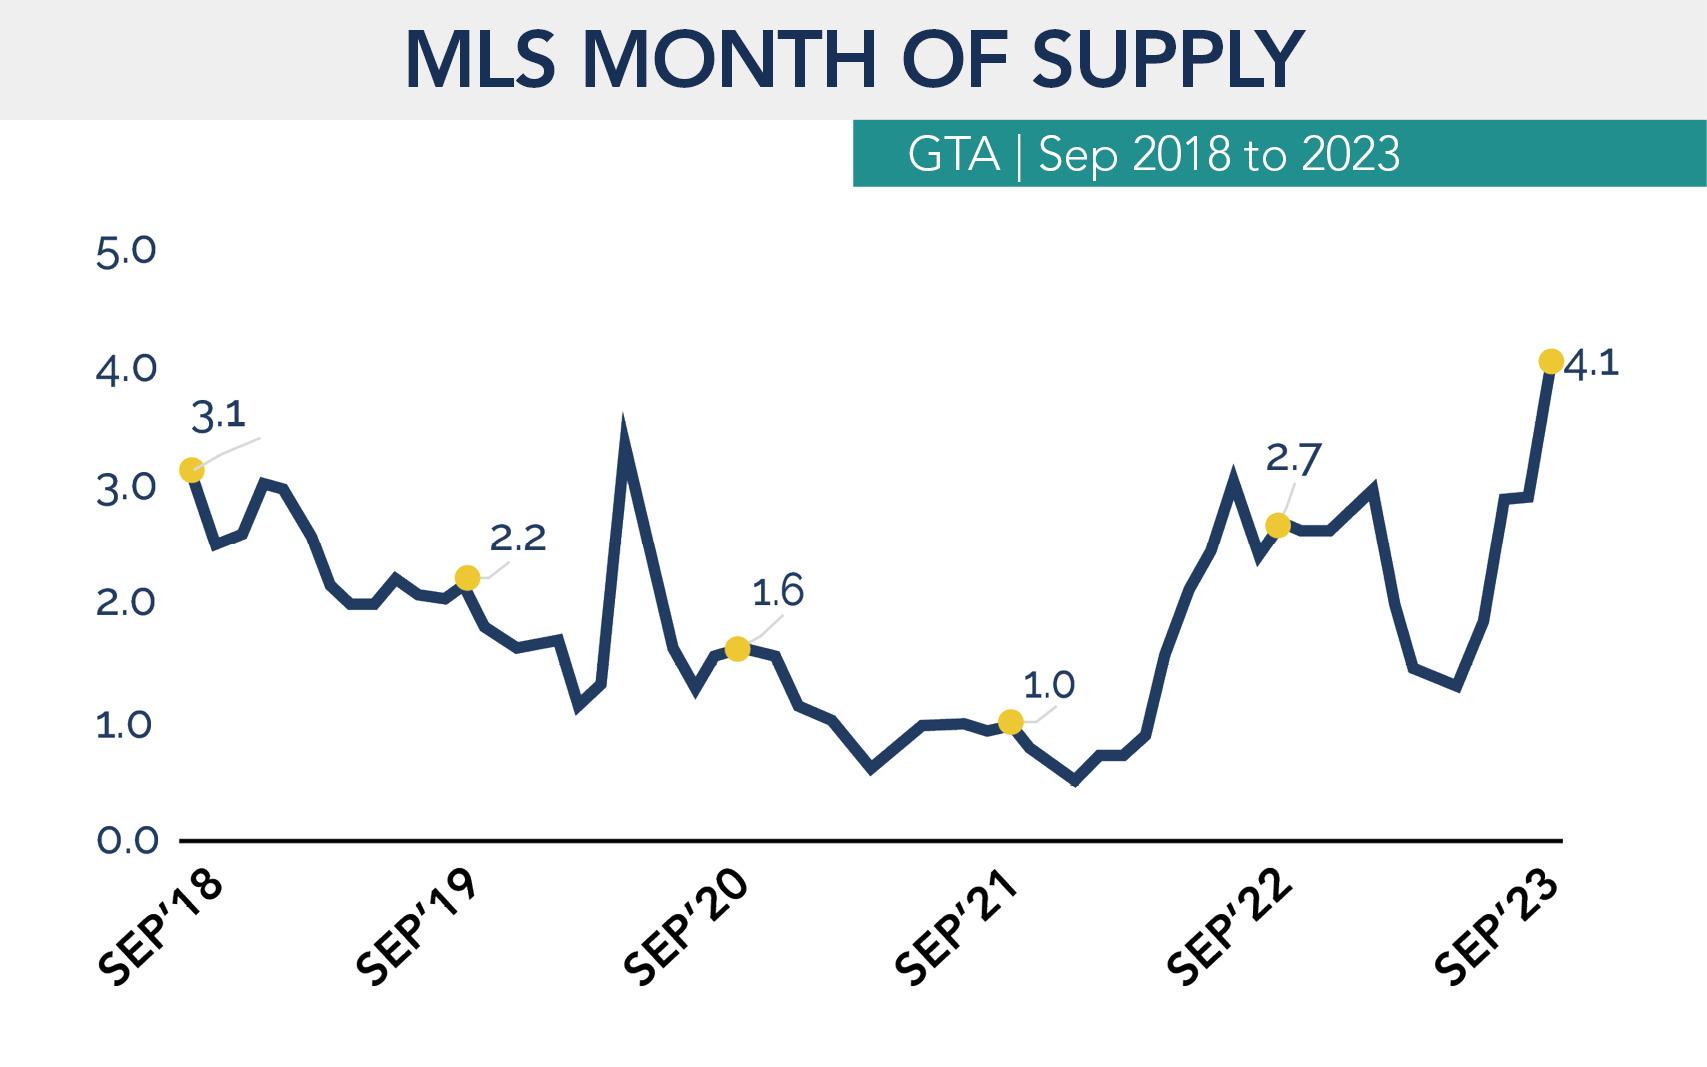
Active listings were up 40% from a year ago to 18,913 units, 15% above the 10-year average. The 4.1 months of supply on the market at the end of September represented the highest level of inventory since early 2009
Key Takeaways

The September results showed a meaningful divergence between homeownership demand supply, which is likely to cause some downward pressure on selling prices in the coming months if the latest trends hold.
It’s clear that high interest rates are starting to have an impact on supply, as homeowners that were previously holding off selling until prices improved are now accepting the new market reality and mortgage renewals are causing some owners to reduce their debt loads (particularly investors). At the same time, continued increases in interest rates have further reduced affordability for buyers, which is creating a softer market environment for prices.
Prices held up remarkably well in September (even rising in some areas) amid a limited degree of excess supply, with active listings remaining within a reasonable range of their historical averages. It will be interesting to watch if sellers are willing to accept lower prices or will remove their listings from the market in the coming months. This will be a critical determinant for the near-term path for prices.
With record population growth occurring and an expected soft landing for the economy (the unemployment is still near all-time lows which will limit distressed sales), any reductions to interest rates are anticipated to improve home buying activity as a large amount of pent-up demand has accumulated. While the short-term market outlook points to challenging conditions in the coming months, the medium to longer term outlook still appears positive to due strong underlying fundamentals.