


Market Watch Q3
How’s the Market Looking in Q3 of 2021
When sales go down, does it means prices go down too?

When Sales decrease, prices DO NOT always go down too.
Sales increased in September across all housing types compared to the previous months.
However, on an annual basis, sales for detached houses were down 29% and sales for semis/rows/towns were down 21%, while condo apartment activity was up 13%.
This means that annually people are buying less detached homes this year compare to last year regardless if they’re buying more compared to last month.
Sales were down year-over-year in September everywhere in the GTA for detached and semi/row/town properties following the record volumes recorded a year ago.
For condo apartments, which didn’t experience the same degree of sales growth as low-rise homes last year, activity was up by double-digits in most areas of the GTA, led by a 23% increase in Central Toronto.
For all Property Types:
In the month of January there were 6, 900 sales, March was the highest month in sales with up to 15 600 and then in August we had the lowest amount of sales with the exception of January at 8 500 sales Finally in September, we have just over 9 000 sales.
When we see that difference between March and September in number of sales, we naturally begin to thing that prices must be weakening since there were less number of sales. However, this is NOT true.
What determines your price is Months of Inventory, we have been operating at 1 months of Inventory for this current year. This past 3 quarters we have had a strong seller's market still getting multiple offers on regular basis!

Sales growth remains the strongest in the 905 region for detached home at above 100% year-over-year
Let's take a look at what has been happening this year, January, February, March & April, they have had crazy amount of sales. Then in the next couple of month, sales have started to level off a little bit.
The market is still very good don't get me wrong prices are still rising but all of a sudden the market started to level off a little more compared to last fall so that's why you see such a big difference compared to previous years.
So far this has been a relatively good year, these past 3 months have been fairly slow which explains why our numbers have been fairly low but this is just after the 3rd quarter of the year, we still have 3 months to go!

Change in Detached sales
The price differential between the two housing types at $818K in September represented a record high, growing by 81% (+$367K) compared to two years earlier.
The fastest growing price bracket for detached houses
Escalated from the $1.5-1.749 million range
Into the $1.75-1.99 million range in September
Posting annual sales growth of 52%.
On an annual basis, detached price growth of nearly 29% in September was more than double that of condo apartments at under 12%.
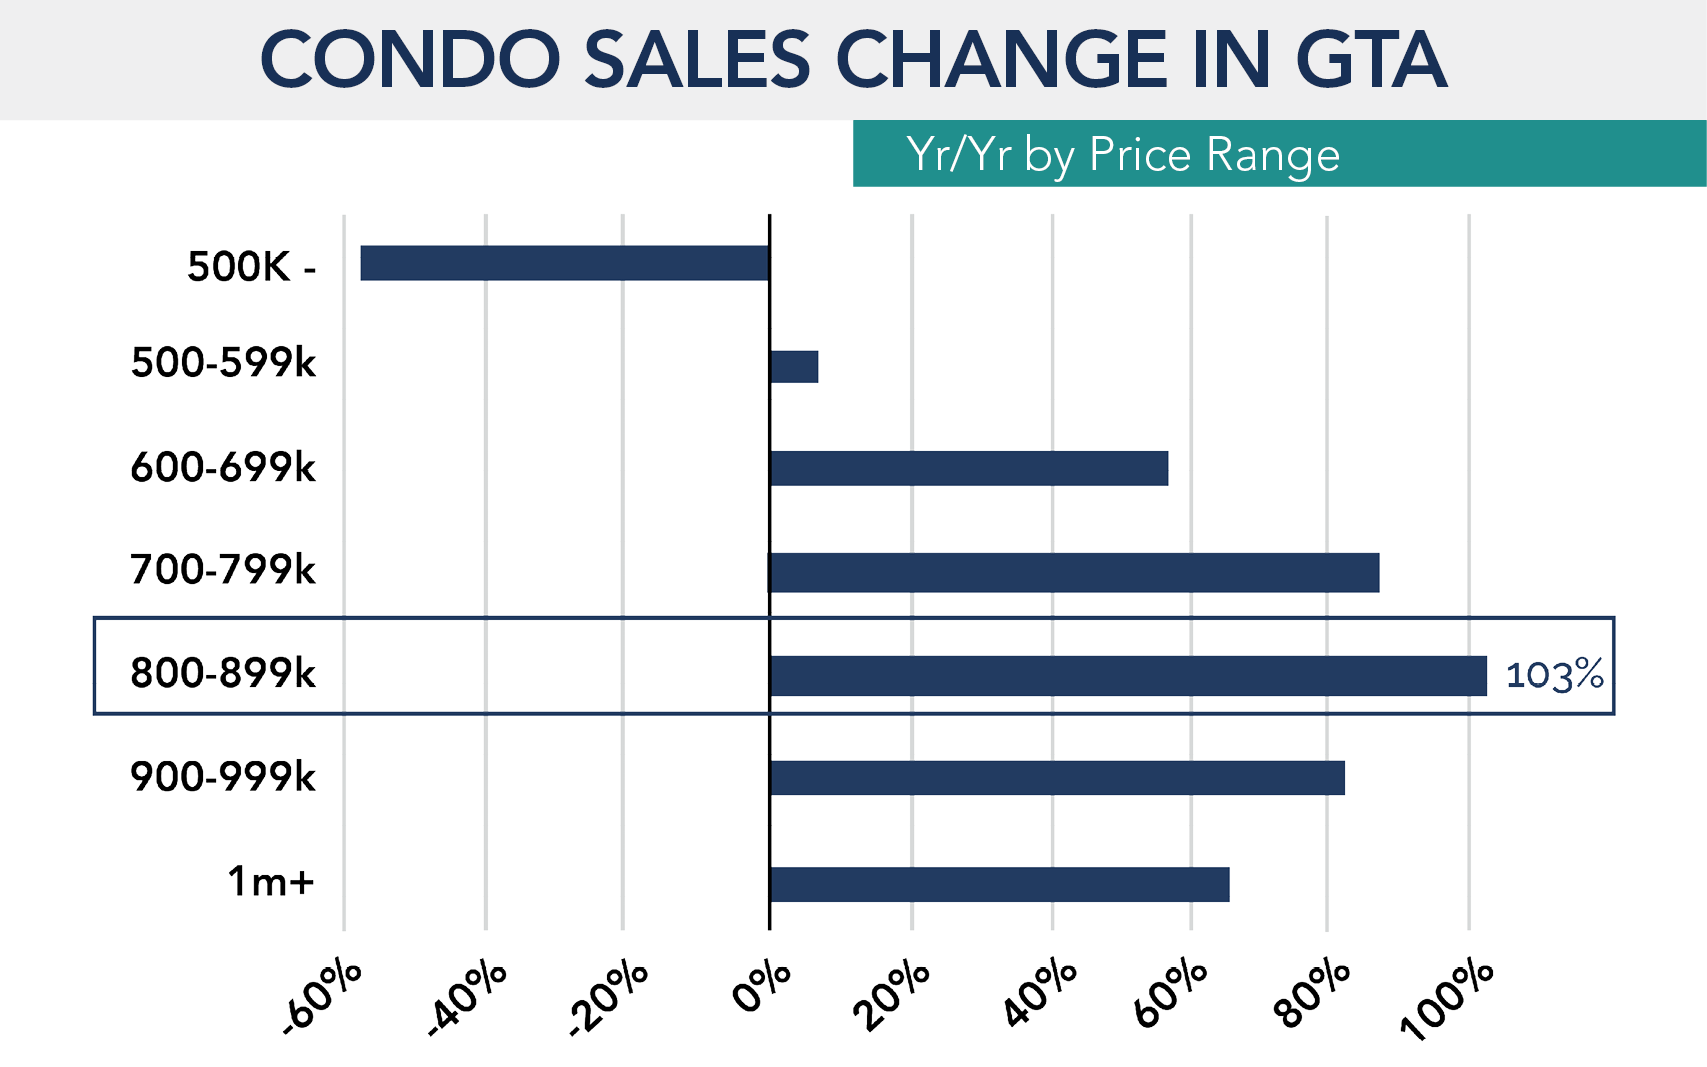
Condo Prices Rise Above $700K as Detached Prices Surpass $1.5 Million
For condo apartments the growth leader for sales remained consistent with the previous month, with the $800- 899K bracket doubling in volume compared to a year ago.
Recent studies have shown that investors are currently representing close to one quarter of home purchases in the GTA. While investors can be productive for the market by increasing rental supply, they also contribute to the lows in resale inventory being experienced.
Investors aren’t the true problem, however, but rather the symptom. To be clear, the GTA has been underbuilding housing for many years, which is the underlying issue.
What is a Supply Indicator?

Now If we look at MOI, we started at 1.1, currently we’re sitting at 1. In the spring we had 3 months were we dipped just below 1 month of inventory when process was spiking at an average of 1.13 million which was 6.1% higher than the previous month
With supply levels remaining low across the market, the rise in demand during September led to a jump in prices for all housing types. Detached prices increased the most compared to August, rising 7% month-over-month to surpass an average of $1.5 million for the first time ever.
A new threshold was also passed for condo apartment prices, which moved above the $700,000 mark with a 3% monthly gain. The 6% monthly prices increase for semis/rows/towns was nearly as strong as detached houses, reaching an average of $980K
Demand remains strong as buyers continue to take advantage of record low borrowing costs, psychology fuels a fear of missing out (from both first-time purchasers and their parents providing them with financial assistance), market confidence grows alongside a full recovery in employment and high vaccination rates, and investors play a larger role in the market.
What’s a Price Indicator?

If we go back to 2012, your average price was 500k whereas our average price right now is 1.13m and that’s only up till the end of September. Over the span of 10 years, prices have only gone up with the exception of 2017-18 where it slipped and went down slightly.
Now why is this important? If we look at the percentage growth over the past 10 years, and this isn’t the end of the year yet and I suspect prices will continue to rise to the end of the year, we can clearly see that prices continue to rise.
This leads to the question when is the best time to buy real estate?
And I’m here to tell you, the best time to buy real estate is when you’re ready to buy real estate. Because real estate is generally a buy and hold product. So it really doesn’t matter WHEN you buy it